Hello, I have a different problem. 1. First when I created the monitor "admin_snmp_dca_base" I did not see the logs in cat /shared/tmp/snmpdca.log
________________________________________________________________________________________
========== /usr/share/monitors/SNMPDCABASE_monitor ==========
Node Name: /Common/xamp03
Node Address: ::ffff:10.1.40.52
SNMP version: v1, community = <sensitive data redacted>, port: 161
Monitor: snmp_dca_base.
User OIDs:
.1.3.6.1.2.1.25.1.6.0 - 0.000000
Main:Weight =1 (weight1 = 0.000000, weight2 = 0.000000)
The default minimum is 1.
[root@AC:Active:In Sync] config #
________________________________________________________________________________________
then I restarted the snmp agent (Agent Start / Stop) and the OID data that I am pulling now appears.
I don't know what relationship they have with the monitor, but it already works.
========== /usr/share/monitors/SNMPDCABASE_monitor ==========
Node Name: /Common/xamp03
Node Address: ::ffff:10.1.40.52
SNMP version: v1, community = <sensitive data redacted>, port: 161
Monitor: snmp_dca_base.
User OIDs:
.1.3.6.1.2.1.25.1.6.0 - 46.000000
i = 0, util = 46.000000, threshold=85.000000, coeff=2.000000
Main:Weight =8 (weight1 = 8.272696, weight2 = 0.000000)
[root@AC:Active:In Sync] config #
________________________________________________________________________________________
When I disable the snmp agent for windows (from the windows server), the node still marks green as active, so this is wrong.
root@(AC)(cfg-sync In Sync)(Active)(/Common)(tmos)# list ltm monitor snmp-dca-base
ltm monitor snmp-dca-base admin_snmp_dca_base {
community public
defaults-from snmp_dca_base
interval 10
time-until-up 0
timeout 30
user-defined hrSystemProcess .1.3.6.1.2.1.25.1.6.0
user-defined hrSystemProcess_coefficient 2
user-defined hrSystemProcess_threshold 85
version v1
}
ltm monitor snmp-dca-base snmp_dca_base {
community public
interval 10
time-until-up 0
timeout 30
version v1
}
root@(AC)(cfg-sync In Sync)(Active)(/Common)(tmos)# show ltm node xamp03
------------------------------------------
Ltm::Node: xamp03 (10.1.40.52)
------------------------------------------
Status
Availability : available
State : enabled
Reason : Node address is available
Monitor : admin_snmp_dca_base
Monitor Status : up
Session Status : enabled
Traffic ServerSide General
Bits In 0 -
Bits Out 0 -
Packets In 0 -
Packets Out 0 -
Current Connections 0 -
Maximum Connections 0 -
Total Connections 0 -
Total Requests - 0
Current Sessions - 0
root@(AC)(cfg-sync In Sync)(Active)(/Common)(tmos)#
I am trying to implement an snmp monitor but it is not yet functional, can someone help me see if I am doing something wrong, or is the snmp monitoring solution not yet functional in BIG-IP F5?
 Nimbostratus
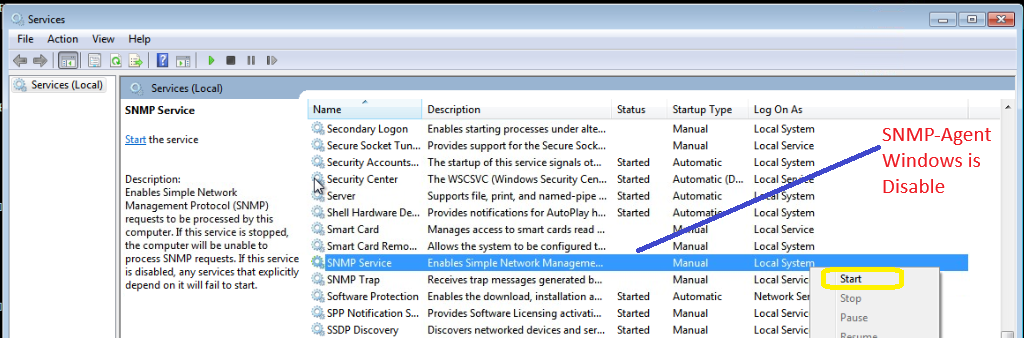